
I am Coco. Welcome to my blog! This is a place dedicated to recording the beautiful scenery, delicious food, and rich culture across Taiwan. I hope that through my footsteps, you can get to know Taiwan even better.
我是可可,歡迎來到我的部落格!是一個專門記錄台灣各地美景、美食與文化的地方。希望你能透過我的腳步,更加認識台灣。
Many people know that I have some experience with passive income. From gold, US dollars, live streaming, and blogging, to my recent venture into stocks—as long as it’s a cumulative type of online endeavor, I am interested. Today, I want to talk about an interesting phenomenon in stock trading: Why is the K-line green when the closing price clearly shows a red “up"? “Does a green K-line from opening high and closing low count as a gain or a loss?"
蠻多人知道,可可對於被動收入有一定的接觸,從黃金、美元、直播、部落格,到近期的股票,只要是累積型的網路工作,可可都有興趣。今天要跟大家聊聊的是股票交易的有趣現象,明明收盤是紅字的上漲,為什麼K線卻是綠色的?「開高走低的綠K棒,到底算漲還是算跌?」
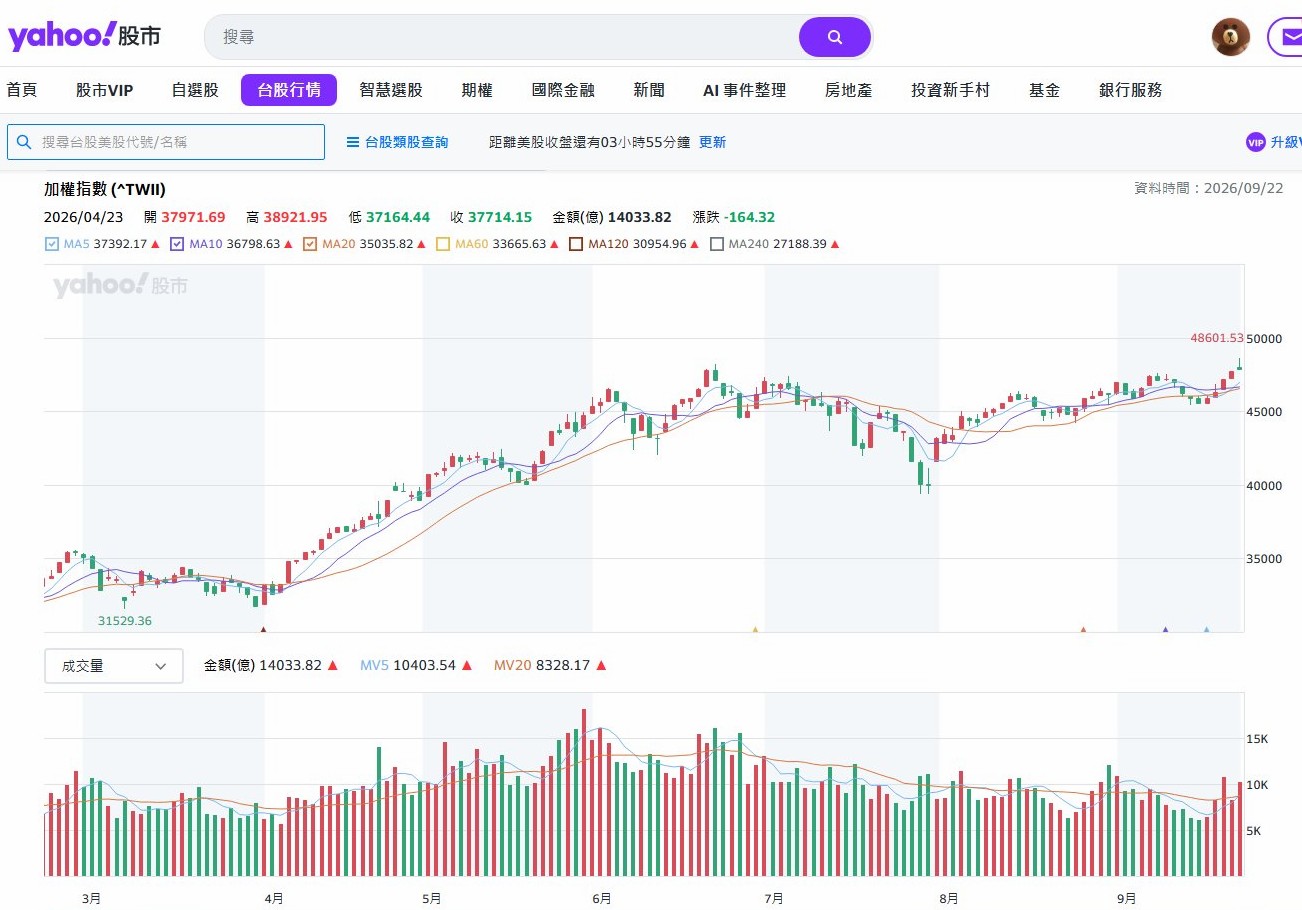
This happened on September 22, 2026. The Taiwan Stock Exchange capitalized on an opening gap up in the morning, even breaking its historical high to hit 48,601 points. Unexpectedly, heavy selling pressure continuously emerged afterward, dragging the index straight down to close at 47,800 points—the absolute lowest price of the day.
這是發生在2026年9月22日這天,台灣股市大盤在早上開盤就跳空開高,甚至一度突破48,601點的歷史新高,沒想到隨後賣壓不斷湧現,指數一路直下,最終收在47,800點,也就是當天最低價。
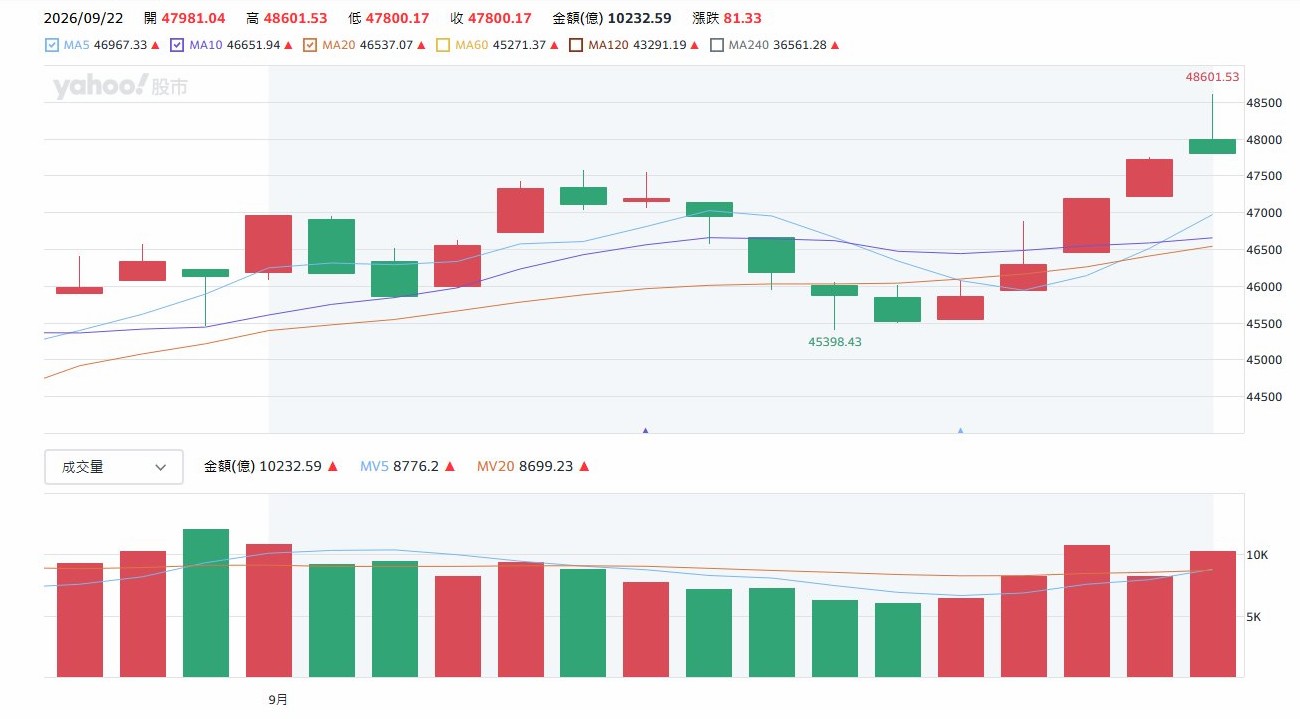
This fierce battle between bulls and bears perfectly demonstrated what it means to “open high but drop below the opening price." Looking at that long green K-line at the closing bell, a thought suddenly crossed my mind: Does today count as a gain or a loss?
在這場多空大戰中,完美示範了什麼叫做「跳高卻低於開盤價」。可可看著收盤時那根長長的綠色K棒,突然產生一種想法,今天到底算漲還是算跌?
After researching the data, I arrived at the conclusion regarding the “comparison baseline."
查了一下資料,得到了看「比對基準」的結論。
- The official definition of up or down is based on “yesterday’s closing price." As long as today’s final closing price (47,800.17) is higher than yesterday’s closing price (47,718.84), it counts as a gain on paper, regardless of the process in between. This is why the price movement figure remains in red text, showing an increase of 81.33 points.
官方定義的漲跌是「昨天收盤價」也就是只要今天最終收盤價(47,800.17)高於昨天的收盤價(47,718.84),不管中間過程如何,帳面上它就是漲。這也是為什麼你看漲跌幅數字依然是紅字、依然寫著上漲81.33點的原因。 - The color of the K-line is determined by “today’s opening price." The K-line represents the intra-day tug-of-war between buyers and sellers. Since today’s closing price was lower than the morning’s opening price (47,981.04), it indicates a pattern of opening high and finishing low with weak buying momentum. Consequently, the K-line is colored “green" and leaves behind a long upper shadow.
K線的顏色看的是「今天開盤價」,K線表示的是當天多空交戰的過程。因為今天收盤價低於早上的開盤價(47,981.04),代表開高走低、買盤後勁不足,所以K線會被著上「綠色」,並且留下一根長長的上影線。
Therefore, September 22 was a classic textbook case of a “fake green K-line, real gain" trend. As retail investors, even though we beat yesterday’s performance, we still felt a wave of disappointment emotionally.
所以,9月22日這天就是一個標準的「假綠K,真上漲」的走勢。身為股民的我們,雖然贏了昨天的自己,體感上卻會感到陣陣的失落感。
As for how to judge when the K-line color doesn’t match the price change figures, I will teach you two of the simplest methods to ensure you are never misled by colors again:
至於怎麼判斷這種K線顏色和漲跌數字對不起來的情況,可可教你兩個最簡單的方法,保證不再被顏色誤導:
- Method 1: Look directly at the color of the numbers. Ignore the bars on the K-line chart! Look straight at the numbers in the quote section. In the Taiwan stock market, if the font is red, it absolutely means it’s up; conversely, if it’s green, it’s down.
- 方法一:直接看數字顏色,不要看K線圖的棒子!直接看報價欄位上的數字。在台灣股市中,字體呈現紅色,就代表絕對是漲;反之,呈現綠色,就是跌。
- Method 2: If you are worried about misinterpreting the colors, the most precise method is to compare the raw numbers. Subtract “Yesterday’s Closing Price" from “Today’s Closing Price." As long as the result is a positive number, today is up; if the result is negative, today is down. This way, you will never feel confused again.
- 方法二:如果連顏色都怕看錯,最精準的方法就是直接比數字。把「今天的收盤價」拿來減去「昨天的收盤價」。只要算出來的數字是正數,今天就是漲;算出來是負數,今天就是跌。這樣一來就不會有錯亂的感覺。
Through this sharing, I hope to help everyone clarify this common stock market knowledge. Next time you see “the gain is in red text, but the K-line is a green bar," don’t doubt your eyes—this is the real trace left behind by the intense battle between market buyers and sellers! END
藉由分享,可可希望能幫大家釐清這個股市小常識。下次看到「漲幅是紅字、K線是綠棒」時,別再懷疑自己的眼睛,這就是市場上多空激戰留下的真實痕跡!END

